Forlag – Publishing Sales & Inventory Analytics Dashboard
An end-to-end analytics dashboard for a Norwegian publishing company, turning raw CSV files into live sales, inventory, and customer insights.
Client
Harald & Eivind – Forlag (Publishing Company)
Location
Norway
Duration
6–8 weeks (Phased)
Team
Zumetrix Labs Team
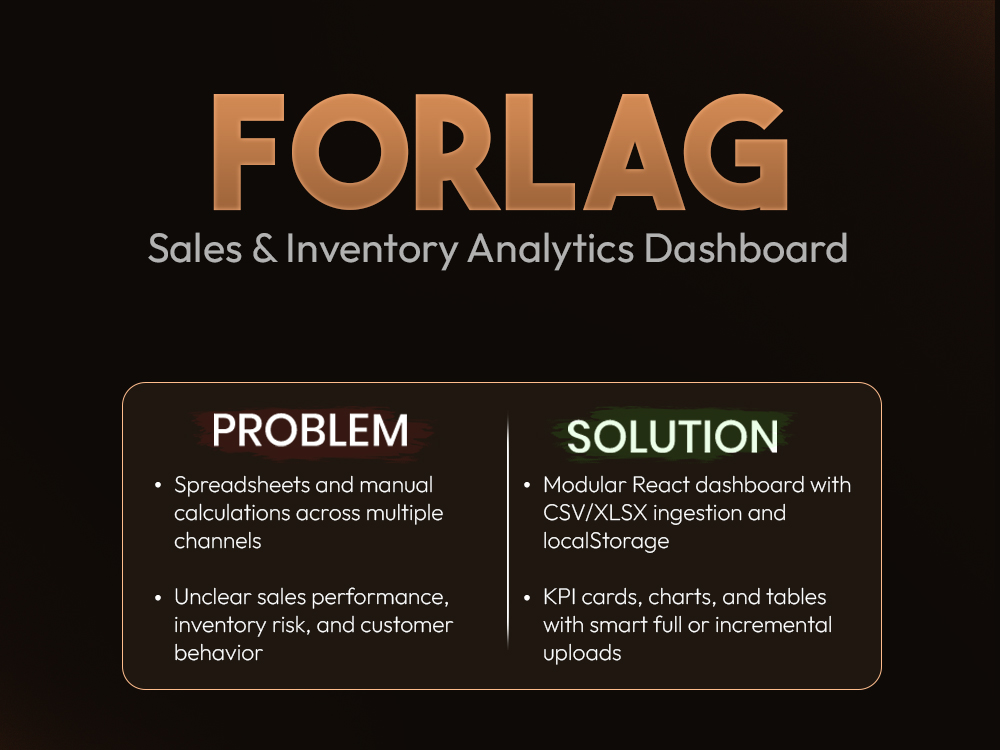
What they came to us with, and what we shipped.
Before
The client managed sales and inventory through multiple spreadsheets and manual calculations, making it difficult to understand MTD/YTD performance, inventory risk, and customer behavior across different channels and time periods.
What We Built
Phase 1 was a modular React dashboard that ingested raw CSV/XLSX files, normalized dates, aggregated metrics per page, and stored processed data in localStorage. Phase 2 replaced that foundation with a real backend — Node.js, PostgreSQL, and Supabase — and added a GitHub Actions pipeline that watches the client's SMTP server for incoming files and inserts them directly into the dashboard, end to end, with no manual step left in the workflow.
Replaced fragile Excel workflows with a visual, always-up-to-date dashboard.
Implemented MTD/YTD comparisons with correct same-period logic across years.
Designed a 7-KPI inventory overview including stock value, dead stock, and category breakdown.
Phase 2: rebuilt on a real Node.js + PostgreSQL + Supabase backend, replacing the original localStorage-only architecture.
Phase 2: fully automated data ingestion — a GitHub Actions workflow watches the client's SMTP server and inserts incoming files straight into the dashboard with zero manual upload.
Achieved fast performance even with 30,000+ order rows.
Proof, not adjectives.
0+
Rows Handled
Smooth performance with thousands of orders and products
-80%
Manual Reporting Time
Reduction in manual Excel calculations and analysis
Fully Automated
Data Ingestion
GitHub Actions watches the client's SMTP server and inserts incoming files straight into the dashboard — no manual upload step
Real-time
Inventory Visibility
Dead stock, stock value, and YTD sold always visible
Built With
"He built a beautiful sales- and inventory dashboard for me over a month, and went out of his way to make it just as I wanted it. He worked around the clock, and we had meetings whenever it was nescessary."